3.4 Monitoring PC state in the IZI system
Article goal
Show how to use the “Monitoring” section in IZI CRM to track the state of gaming computers, analyze their operation, and prevent technical failures.
Who this article is for
- Club owners
- Club administrators
- Technical specialists who monitor equipment stability
What you will learn
- Where the “Monitoring” section is located in IZI CRM
- How to select a PC and set the display period
- Which parameters are shown and what they mean
- How to interpret temperature, load, memory and disk metrics
- What to do if data is not displayed or behaves incorrectly
Prerequisites
Before you start, make sure that:
- You are logged into CRM under a Club administrator or Club owner account
- Monitoring is enabled on gaming PCs (via IZI Monitoring client software)
- Computers are online and accessible on the club network
Where the “Monitoring” section is located
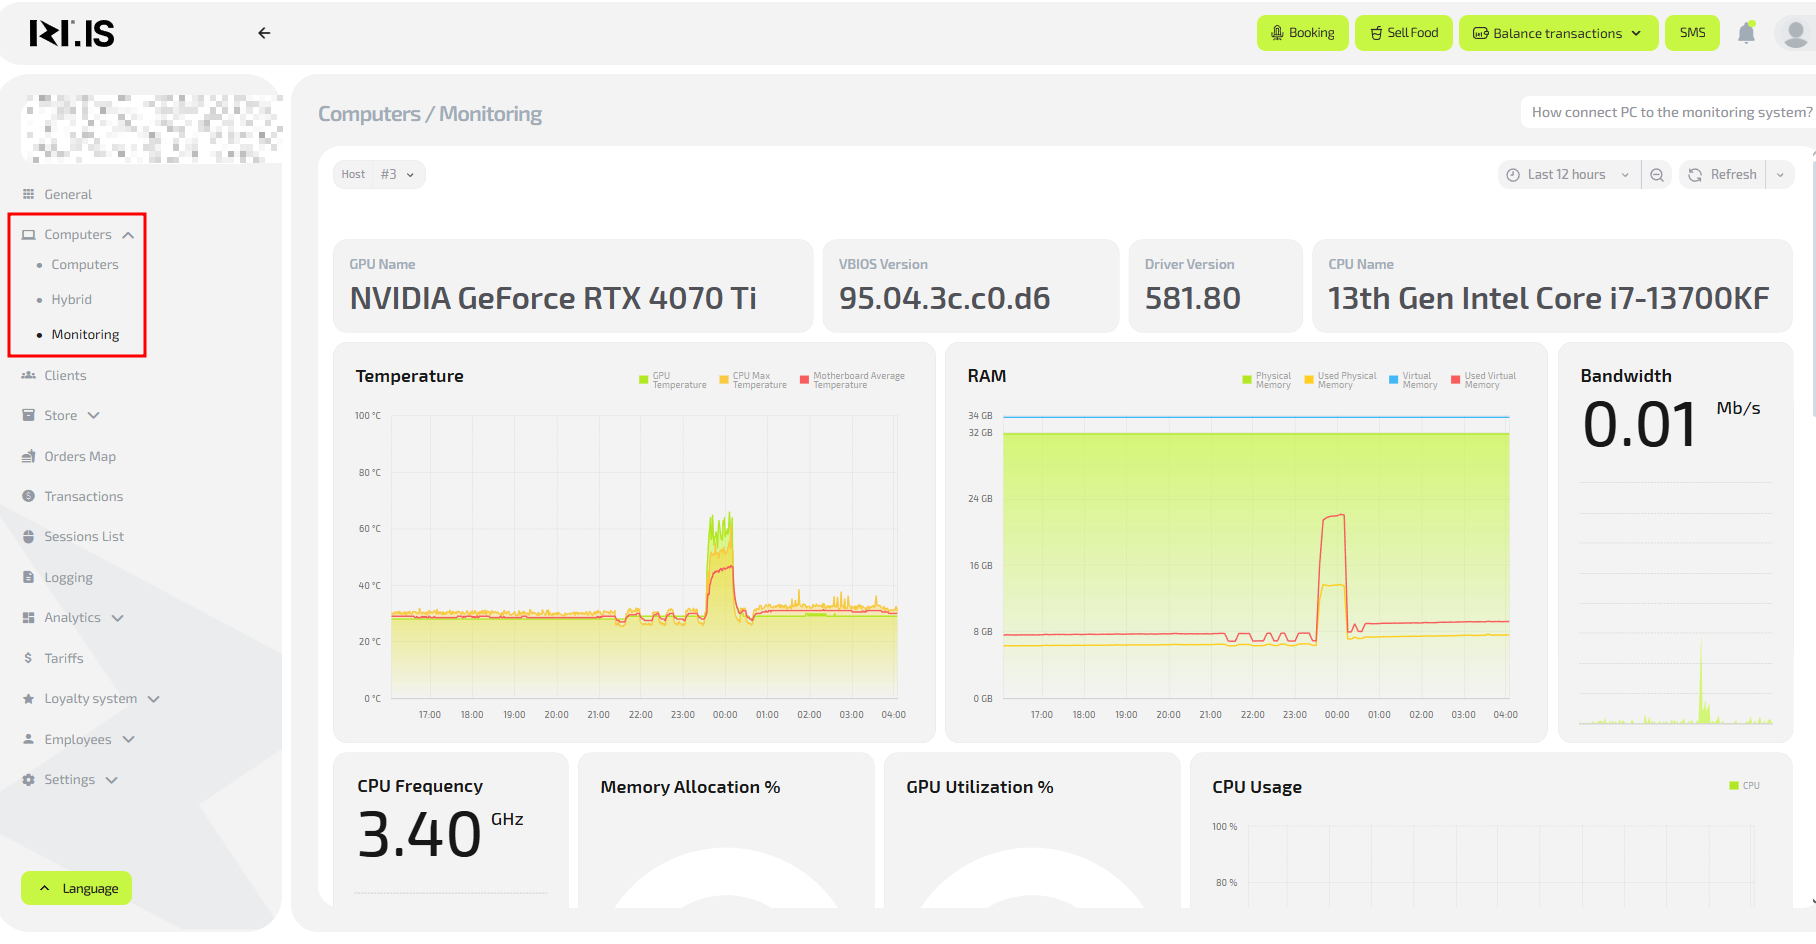
To open monitoring:
- Log in to IZI CRM with your account.
- In the left menu, select Computers.
- In the dropdown, click Monitoring.
- A window with data about the current state of the selected PC will open.
What you can do in the “Monitoring” section
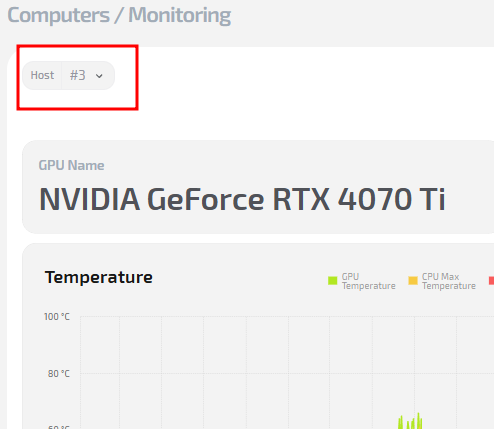
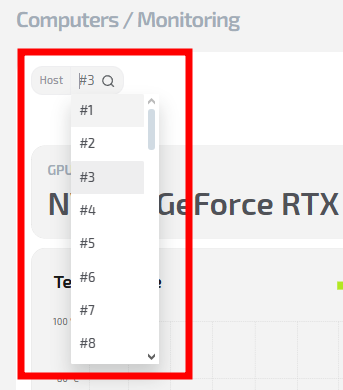
1. Select the required PC
At the top of the window, you can select the club computer whose technical metrics you want to view.
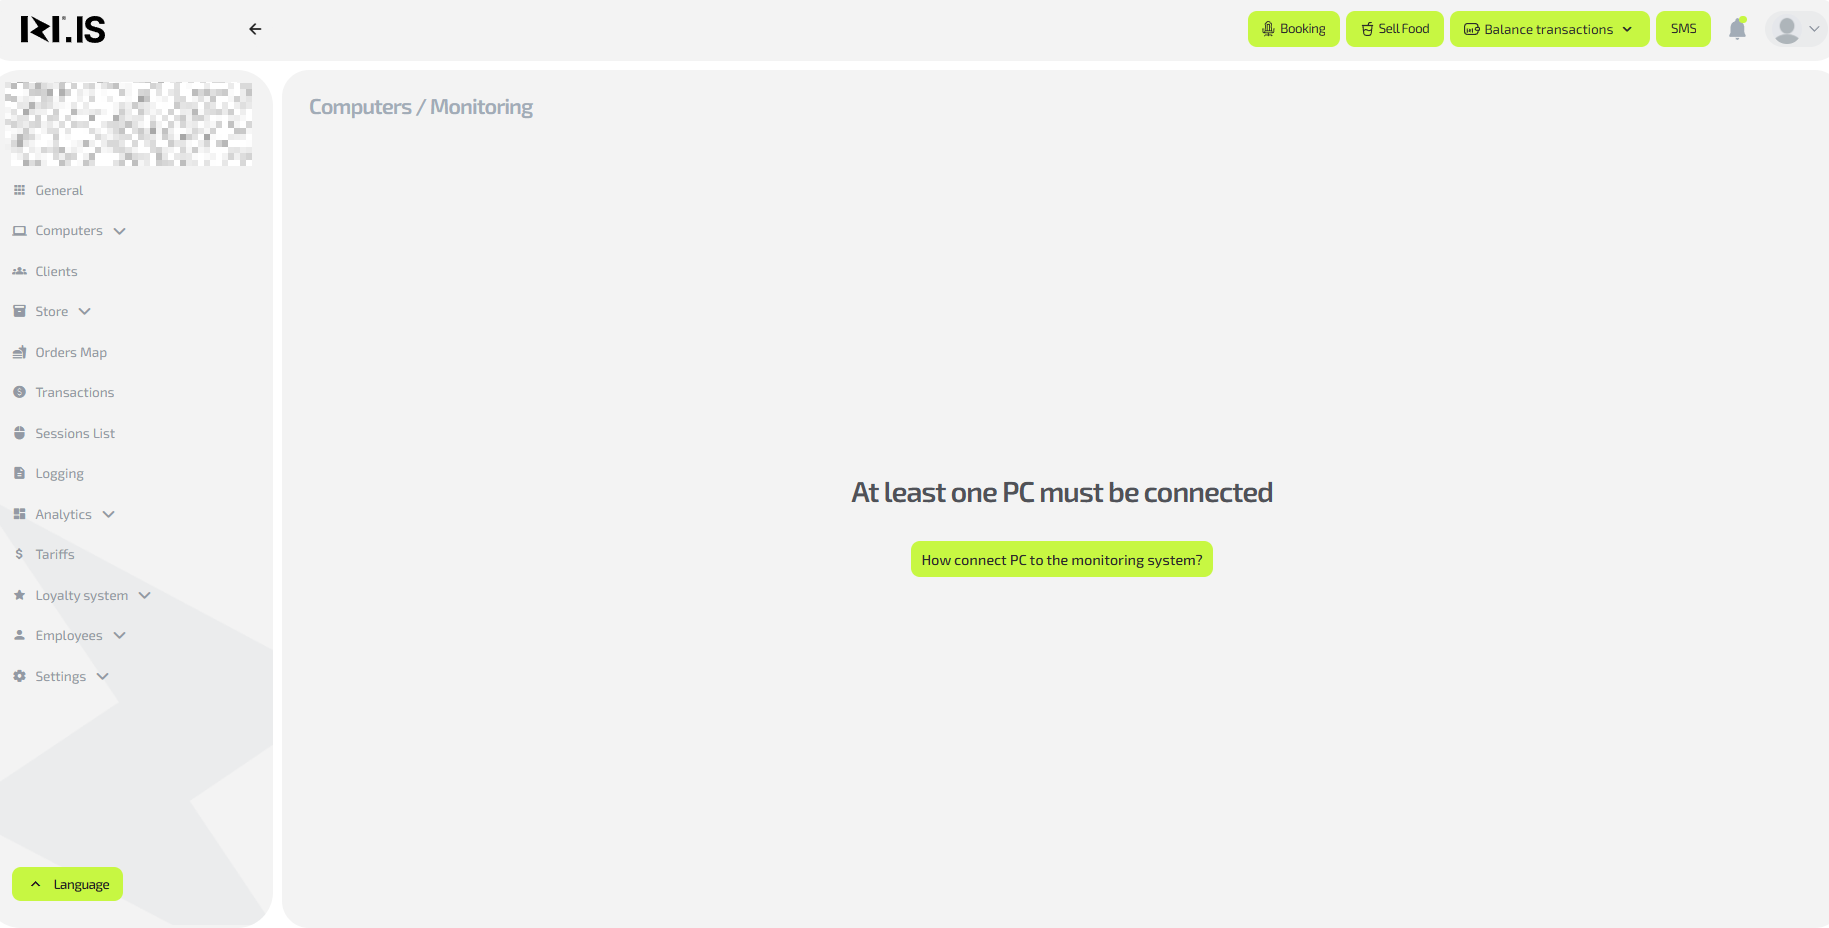
2. Check whether monitoring is connected
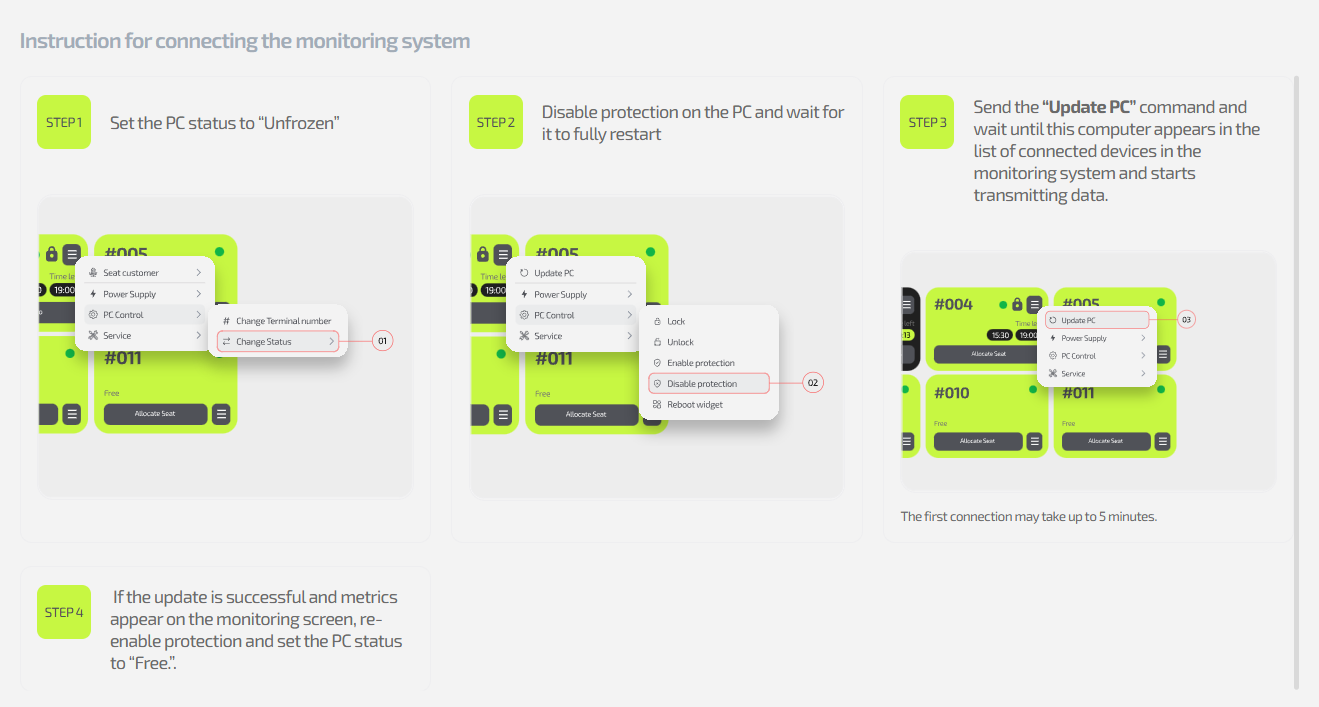
If monitoring on the PC is not activated:
- instead of charts and metrics you will see a button
“How to connect a PC to the monitoring system”; - when you click it, an instruction will open on how to install and activate monitoring for this PC.
3. Configure period and display parameters
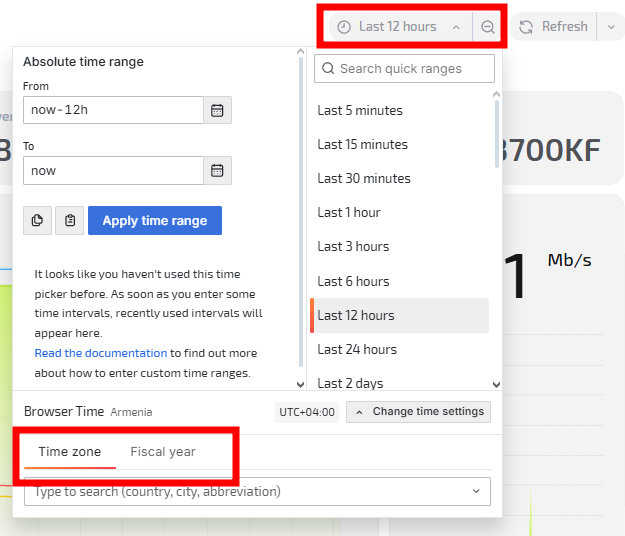
In the upper-right corner you can set:
- Time interval — last 1 hour, 12 hours, day, week or a custom range;
- Time zone — defines the time reference for data;
- Start of reporting year — used for building yearly analytics.
4. Data refresh
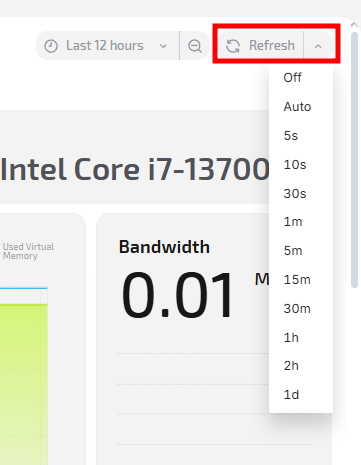
The system supports two modes:
- Manual refresh — click Refresh;
- Automatic refresh — select an interval (for example, 30 seconds, 1 minute, 5 minutes).
Which parameters monitoring shows
System information

| Parameter | Description |
|---|---|
| GPU Name | GPU model (for example, NVIDIA GeForce RTX 3060). |
| VBIOS Version | Video BIOS version — useful for diagnostics or driver updates. |
| Driver Version | GPU driver version; affects game stability. |
| CPU Name | CPU model (for example, Intel Core i5-10600KF). |
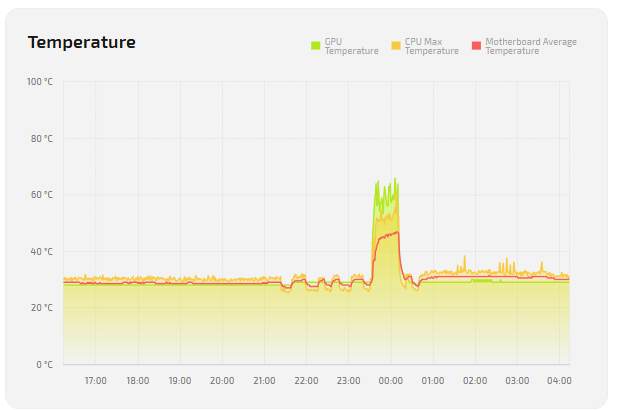
Temperatures
| Parameter | Description |
|---|---|
| GPU Temperature | Current GPU temperature. Helps assess cooling and load. |
| CPU Max Temperature | Maximum CPU temperature in the selected period. Helps detect overheating. |
| Motherboard Average Temperature | Average motherboard temperature; shows overall system heat. |
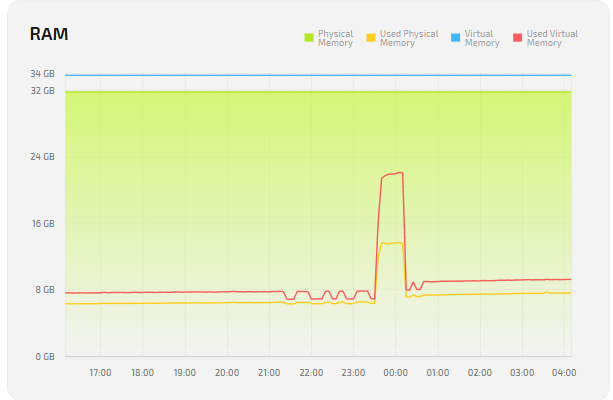
RAM
| Parameter | Description |
|---|---|
| Physical Memory | Total installed physical memory (RAM). |
| Used Physical Memory | Amount of physical memory currently in use. |
| Virtual Memory | Total virtual memory (RAM + page file). |
| Used Virtual Memory | Amount of virtual memory in use; growth may indicate RAM shortage. |
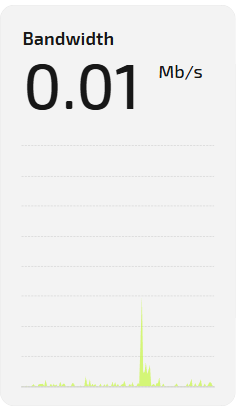
Network
| Parameter | Description |
|---|---|
| Bandwidth | Current network throughput (Mbps). Helps control link load. |
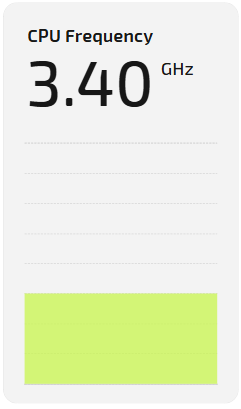
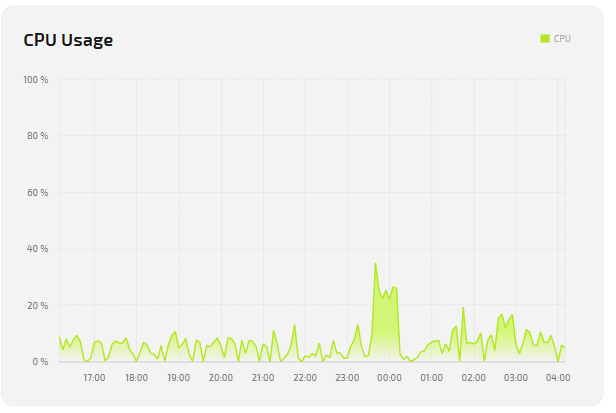
CPU
| Parameter | Description |
|---|---|
| CPU Frequency | CPU operating frequency (GHz), reflects load mode. |
| CPU Usage | Average CPU load in percent. Used to analyze PC performance. |
GPU
| Parameter | Description |
|---|---|
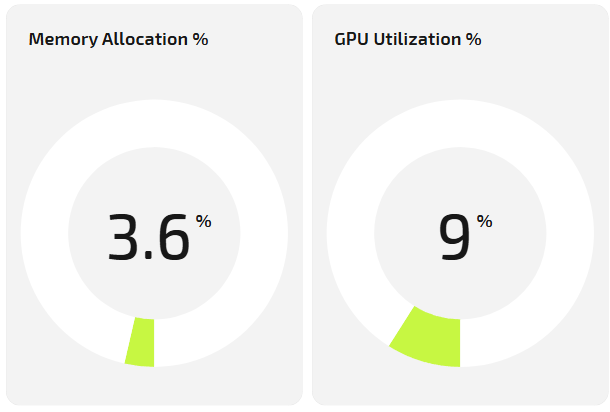
| Memory Allocation % | Percentage of video memory used. |
| GPU Utilization % | Actual GPU load in percent. |
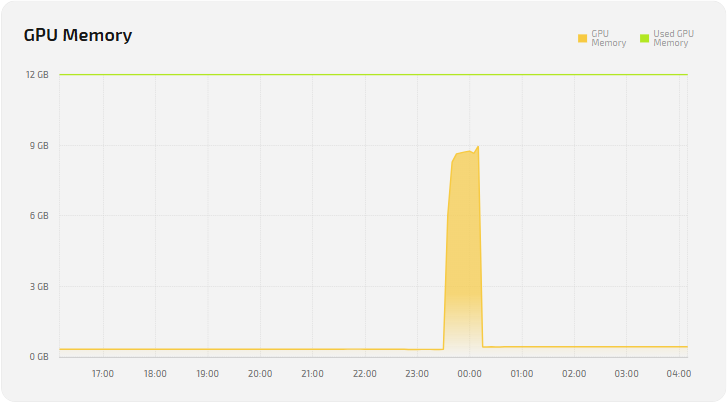
| GPU Memory (Total / Used) | Total and used video memory. |
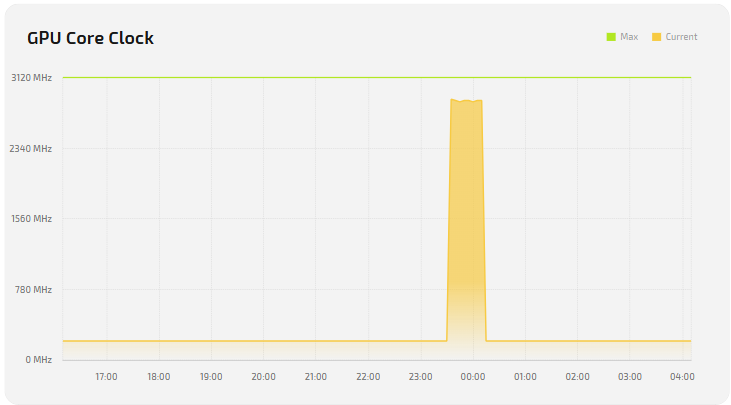
| GPU Core Clock | GPU core clock (current and maximum); affects FPS. |
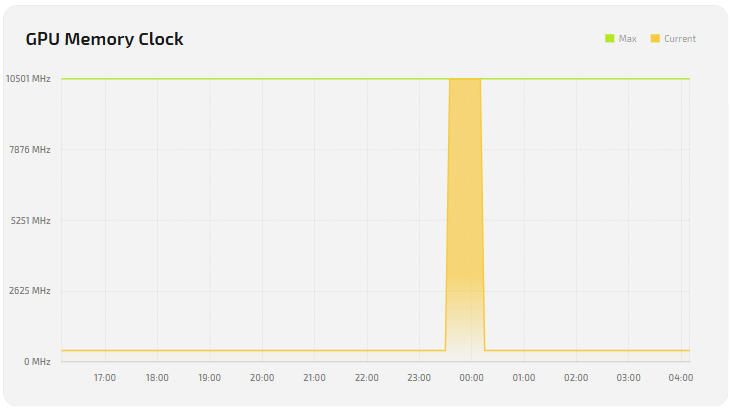
| GPU Memory Clock | Video memory clock (current and maximum); affects bandwidth. |
Disks
Activity
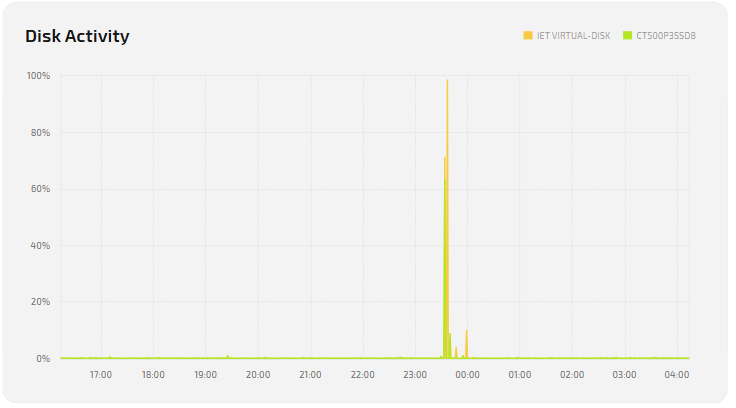
- Disk Activity — disk usage graph for read/write operations (in %).
Free space
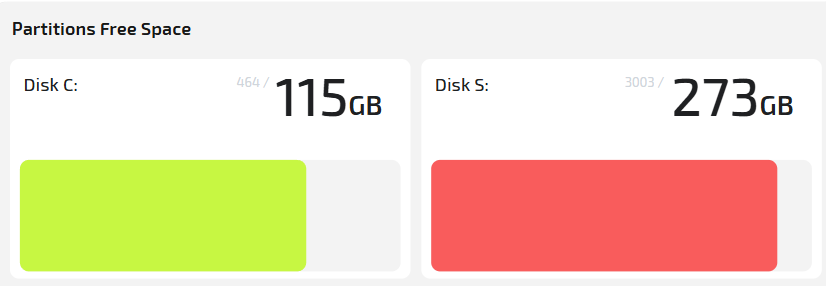
- Disk C: free / total
- Disk D: free / total
Shows total and available size on each disk.
Load
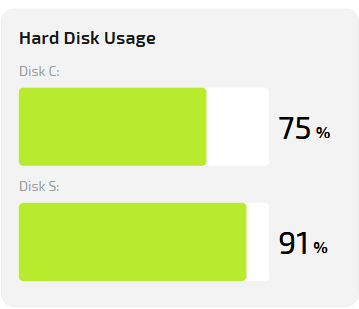
- Hard Disk Usage — real-time disk usage percentage.
High values for a long period may indicate background processes or disk issues.
Throttling reasons (performance limits)
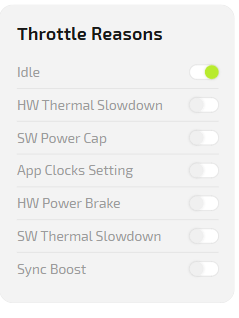
| Status code | Meaning |
|---|---|
| Idle | PC is idle, no significant load. |
| HW Thermal Slowdown | Performance reduced due to overheating (thermal protection triggered). |
| SW Power Cap | Power is limited by software power-saving settings. |
| App Clocks Setting | Clock frequency limited by an application or driver profile. |
Typical situations
Situation 1. No data for the PC in the section
Reason: monitoring is not connected on this PC.
Solution: click “How to connect a PC to the monitoring system” and follow the instruction.

Situation 2. Charts are empty for part of the day
Reason: the PC was turned off or in sleep mode.
Solution: make sure the station is powered on and connected to the network.
Situation 3. Temperatures increased significantly
Reason: high gaming load, dust, weak cooling.
Solution:
- Check fan condition.
- Clean the system from dust.
- Replace thermal paste if needed.
- Make sure room temperature in the hall is within normal range.
Situation 4. GPU Utilization is always 0%
Reason: the GPU is not being used.
Solution:
- Launch a game or test.
- If the value stays at 0% — contact support.
Situation 5. Time on charts is displayed incorrectly
Reason: wrong time zone selected.
Solution: set the correct time zone in monitoring settings.