3.10 Analytics: how to make management decisions based on club data
Article goal
Show the owner or manager how to use the “Analytics” section to evaluate club performance, identify problem areas, and plan further actions. The goal is not just to look at numbers, but to understand what stands behind them and how to react.
Who this article is for
- Club owner
- Manager
- Senior administrator
What you will learn
- How to assess the overall financial state of the club for a period
- How to analyze the effectiveness of tariff and bar sales
- How to identify periods of low load and high demand
- How to track client loyalty and behaviour
- How to identify the most profitable and unprofitable items
Prerequisites
- Access with owner or manager rights
- Closed shifts available for the selected period
Step-by-step guide
Step 1. Select the analysis period

Why this is needed: To compare data in similar conditions (for example, week to week or month to month) and see dynamics.
- At the top of the “Analytics” section select the required period (for example, October 2025)
- The system will automatically recalculate all metrics
Tip: Always compare the current period with the previous one — this helps to immediately notice growth or decline in key metrics.
Overview of reports
1. Main indicators
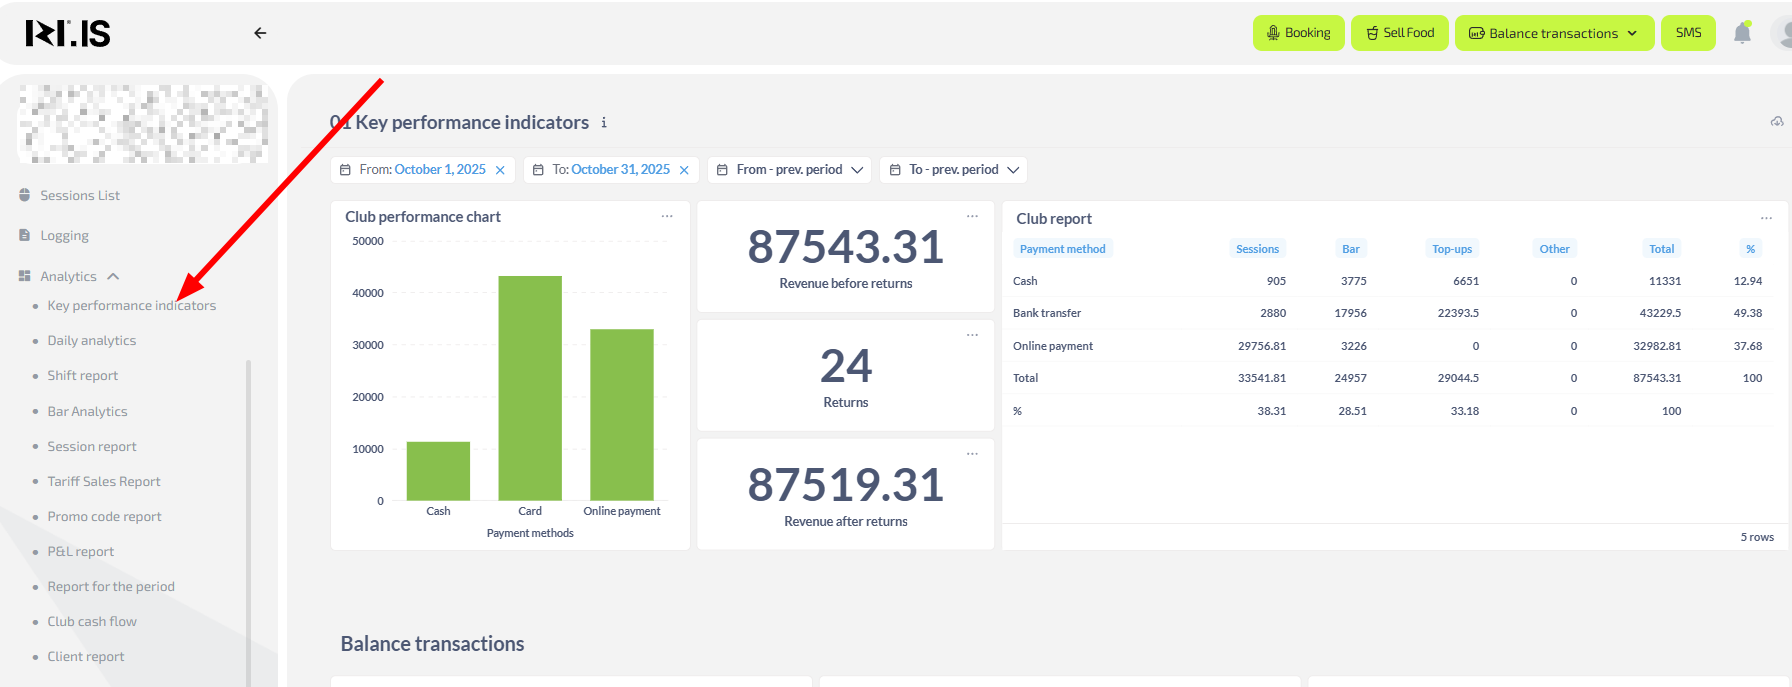
Why this is needed: To assess the health of the business at a glance.
- Revenue without refunds — total income amount. If it is falling, check session and bar reports
- Load (occupancy) — average percentage of occupied PCs. If it is low, review tariffs or launch promotions
- ARPU (average revenue per user) — shows how much one client brings on average. If it is decreasing, consider stimulating bar purchases or promoting more expensive tariffs
- Number of sessions and play time — if there are many sessions but little total time, clients leave quickly. Check whether there are issues with PCs or service
2. Daily analytics
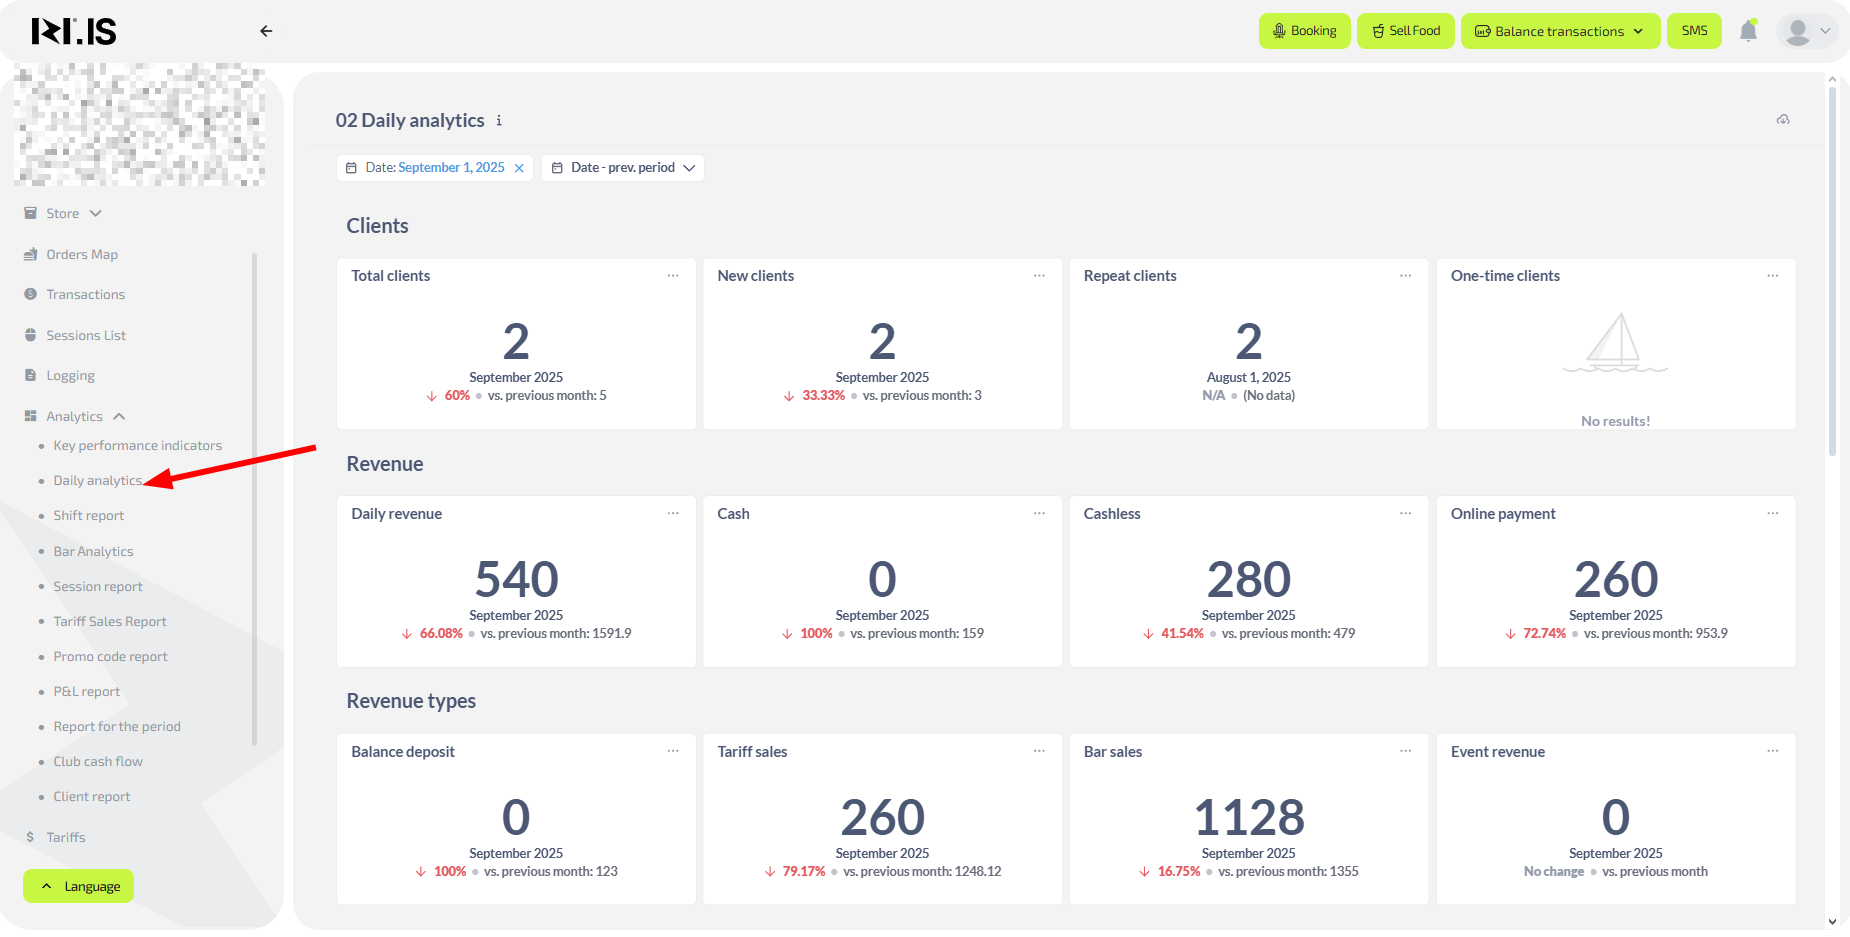
Why this is needed: To react quickly to daily changes.
- Daily revenue — compare with previous days. A sharp drop is a reason to check for technical issues
- Revenue composition — see which sources bring more (balance top-ups, bar, tariffs). If bar revenue is falling, you may be missing popular items
- Number of clients and new clients — a drop in new clients is a signal to strengthen marketing or run promotions for newcomers
3. Shift report
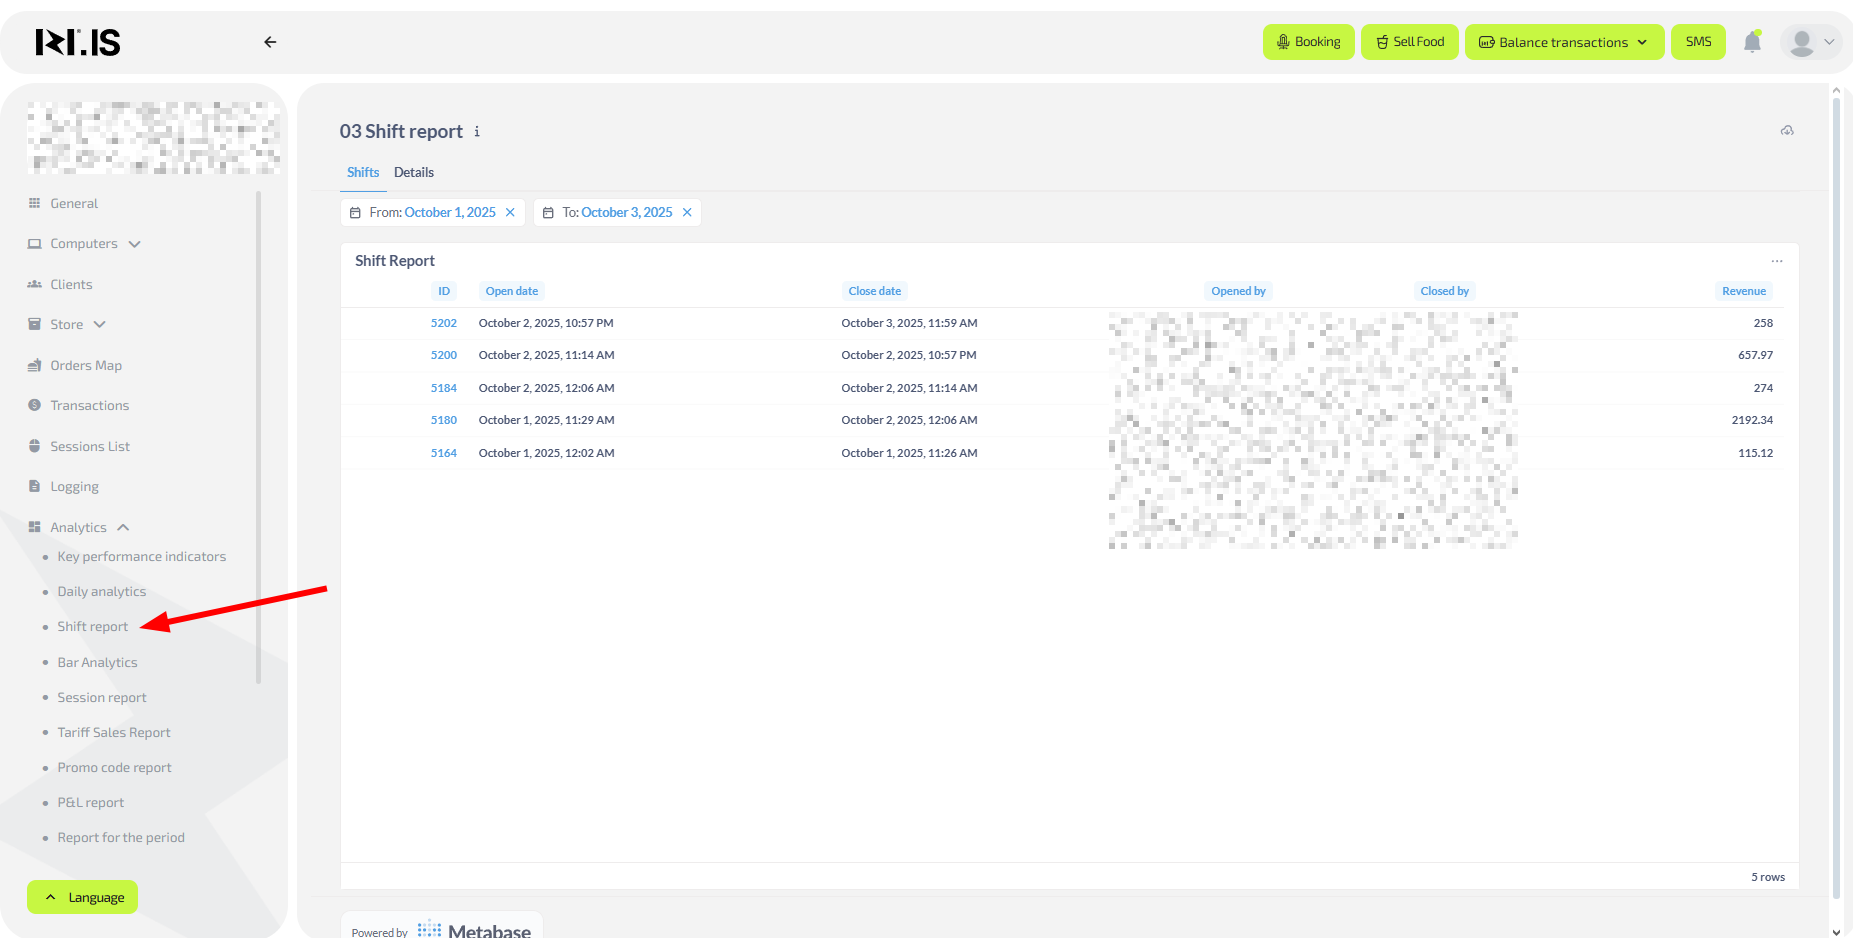
Why this is needed: To control administrators’ work and find mistakes when closing shifts.
- Shift list — check whether all shifts are closed on time
- Shift details — click the shift ID to see all operations; this helps find discrepancies or staff issues
4. Bar analytics
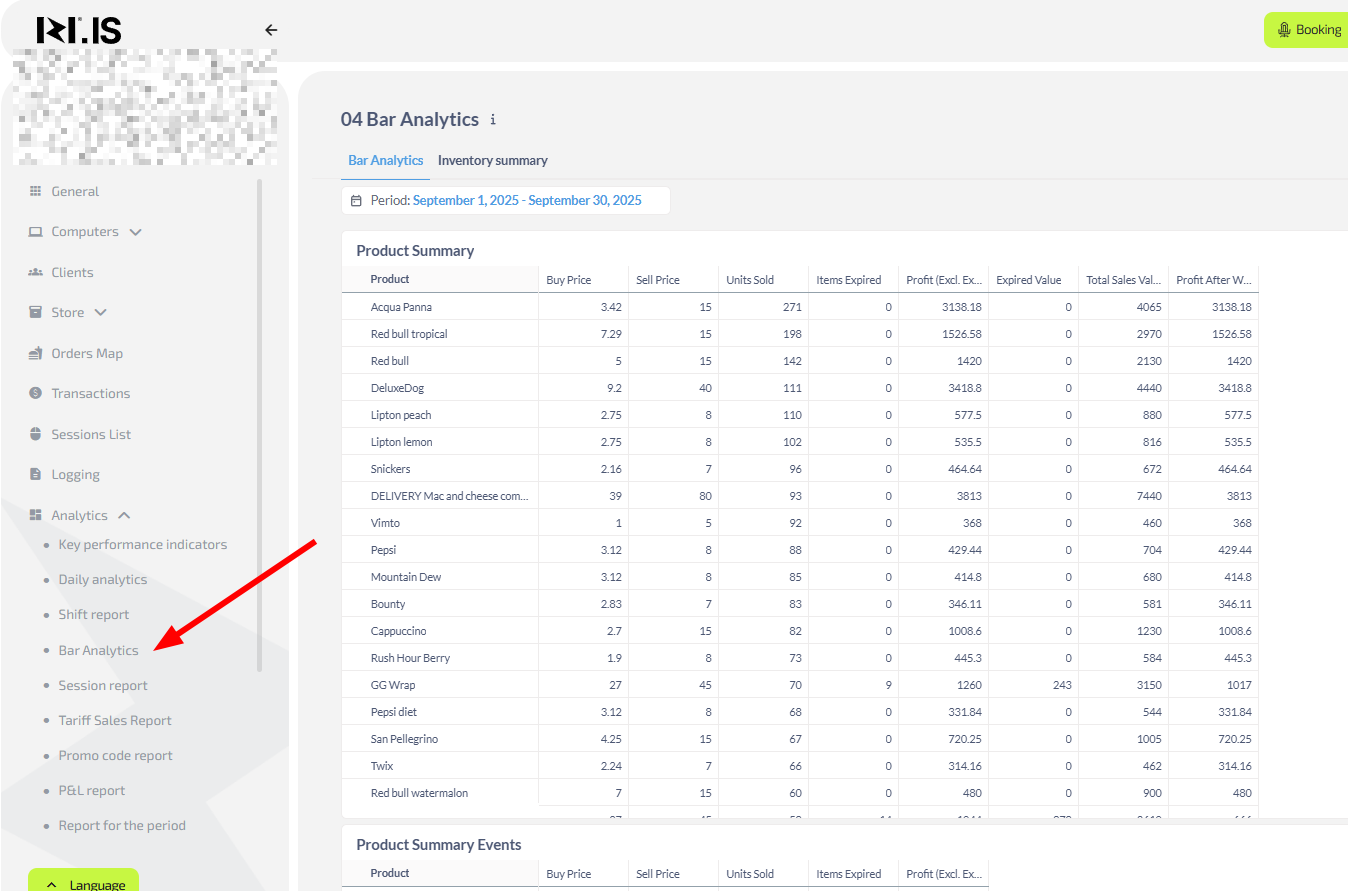
Why this is needed: To manage assortment, purchasing and increase profit.
- High-profit items — for example, “Flash Bubble” or “YorkFresh sandwiches”. Increase their stock
- Low-margin or high-write-off items — for example, “Water”. Review purchase prices or storage conditions
- Profit after write-offs — shows the real profitability of an item. If write-offs are high, check expiration dates and storage conditions
5. Sessions report

Why this is needed: To understand client behaviour and tariff effectiveness.
- Returning clients — if they are less than 50% of total, strengthen your loyalty program
- Average session length — if it is decreasing, clients may be uncomfortable (noise, PC problems)
- Sessions < 10 minutes — if there are many, check whether there are technical issues when launching games
6. Tariff sales report
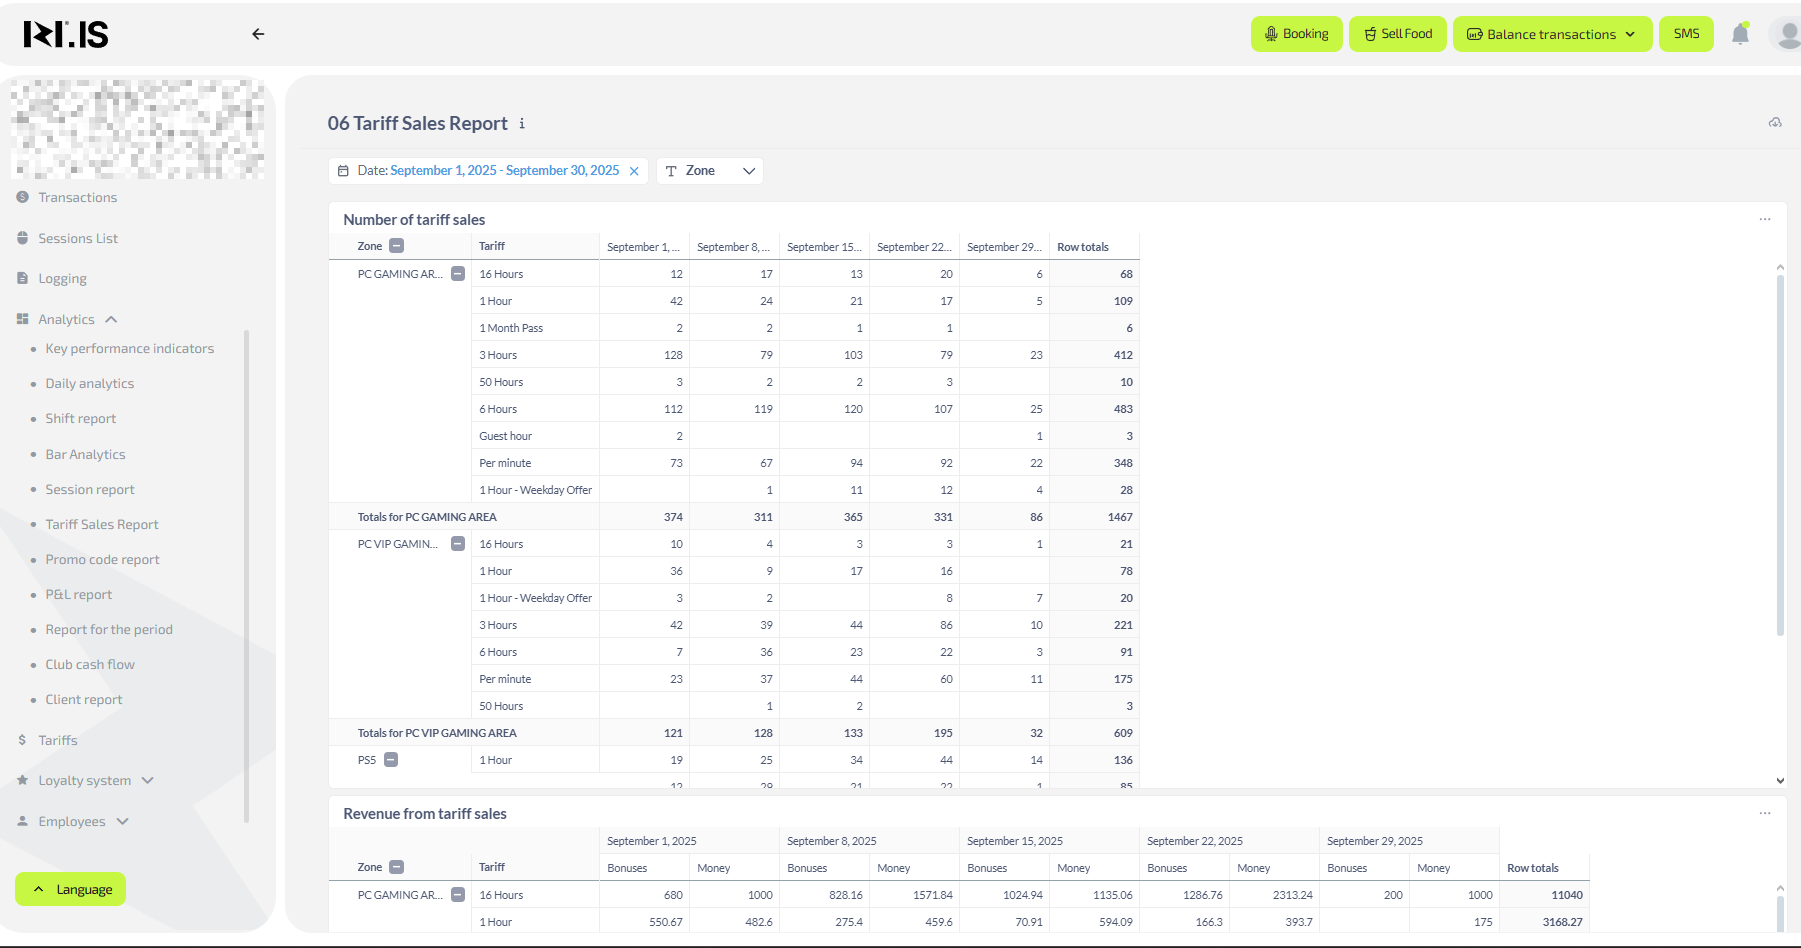
Why this is needed: To identify the most popular and profitable tariffs.
- Number of sales per tariff — see which tariffs are purchased more often (for example, “Per-minute” or “Cyber hour”)
- Revenue from tariff sales — compare which tariffs bring more money
- Purchase graph — observe sales peaks; during these periods you can offer additional services (bar, booking)
7. Promo code report

Why this is needed: To evaluate campaign and promotion effectiveness.
- Promo activations — how many times each promo code was used
- Clients attracted — how many new clients came using promo codes
8. P&L report (Profit and Loss)

Why this is needed: To see net profit and main income/expense categories.
- Total revenue — compare with the previous month
- Profit — if profit is falling while revenue grows, check expenses (purchases, write-offs, bonuses)
9. Period report
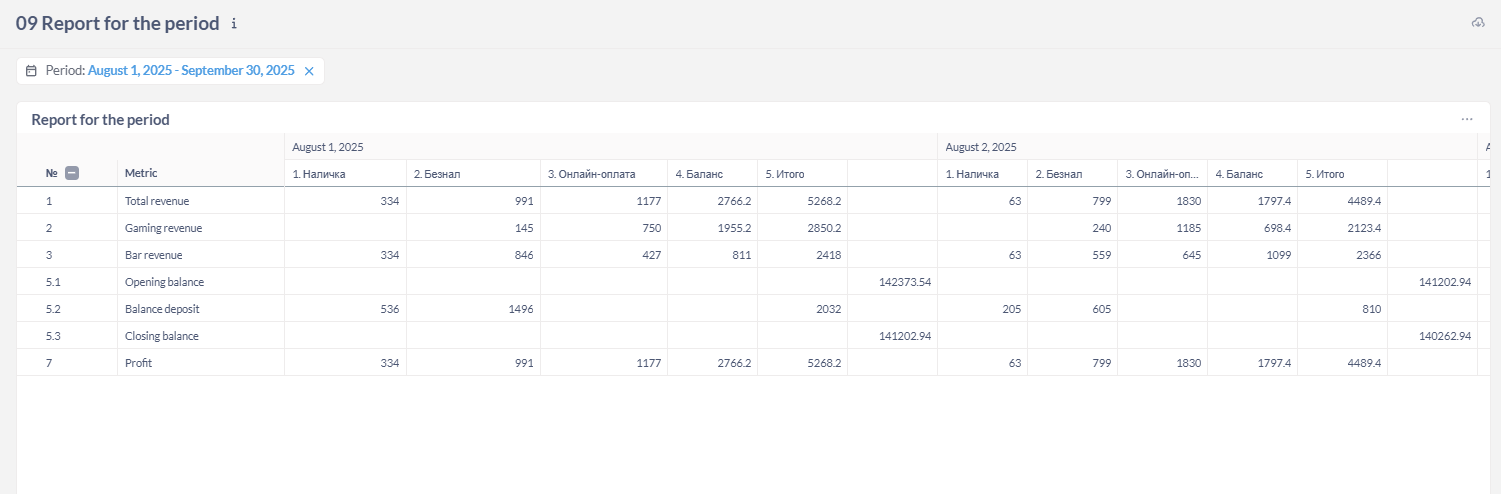
Why this is needed: To analyze money movement by day in detail.
- Balance top-ups — if they are declining, simplify the top-up process or launch a promotion
- Game revenue and bar revenue — compare their dynamics
10. Club funds movement
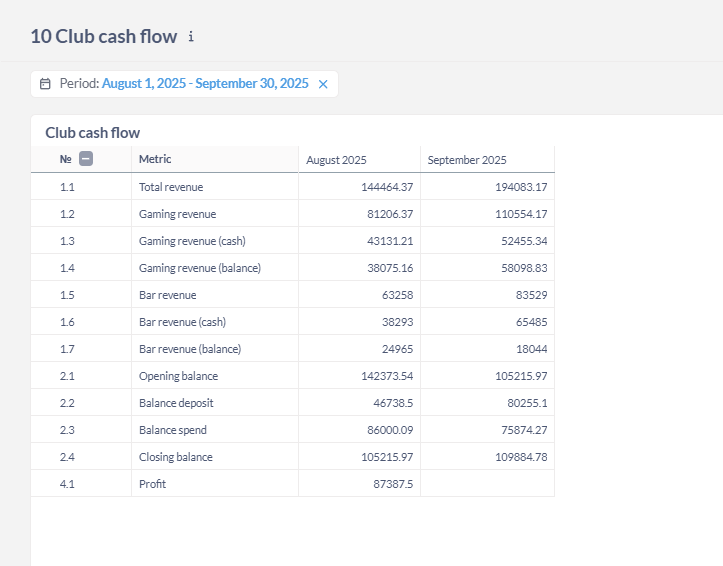
Why this is needed: To track movement of money on client balances and understand how much is “frozen”.
- Opening and closing balance — shows how much money is on client accounts
- Balance spending — if clients do not spend their funds, remind them that they can pay for tariffs or bar with their balance
Common situations
| Problem | Solution |
|---|---|
| Revenue is falling but the number of sessions is growing | Check average check and tariffs. Clients may be switching to cheaper tariffs |
| High write-offs in the bar | Check expiration dates and storage conditions of items |
| Few returning clients | Strengthen the loyalty program, set up automatic reminders |
| PCs are idle during peak hours | Introduce booking or encourage prepayment |
| Low average bar check | Add combo offers or launch a “dessert as a gift with coffee” promotion |